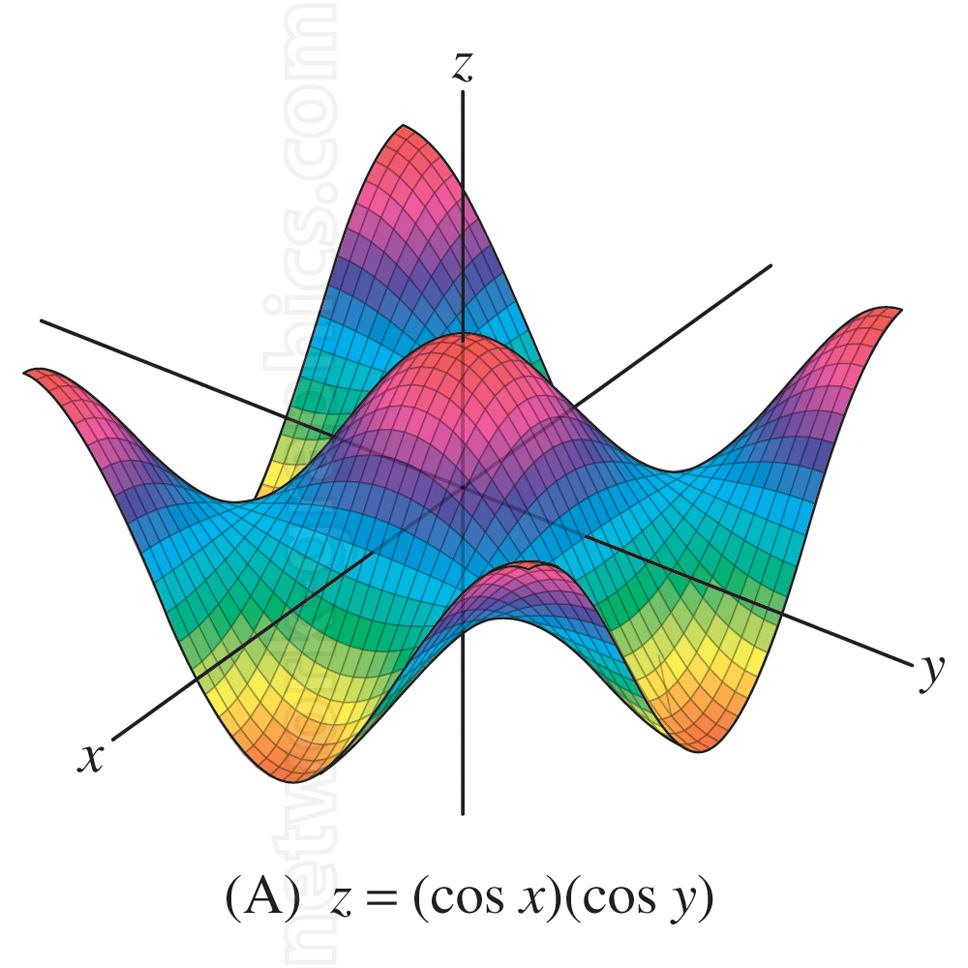
3D surface of (cos x)(cos y).

This illustration is a 3D surface plot of the function z = cos x cos y with rainbow gradient showing oscillating peaks and troughs, wireframe grid overlay, and x, y, and z axes.
The function z = cos x cos y is a product of two cosine functions, one in the x-direction and the other in the y-direction. This function exhibits periodic behavior in both variables, creating a repeating pattern of peaks and troughs along the surface.
This visualization is ideal for mathematical modeling, multivariable calculus demonstrations, and trigonometric function analysis in mathematics textbooks or research publications.
We can provide sample images or create custom illustrations tailored to your projects. If you are looking for an illustration of this type, or from another subject area, you can contact us to discuss your needs.
Network Graphics / Division of Abramson & Wickham Graphics Inc.
All rights reserved.

