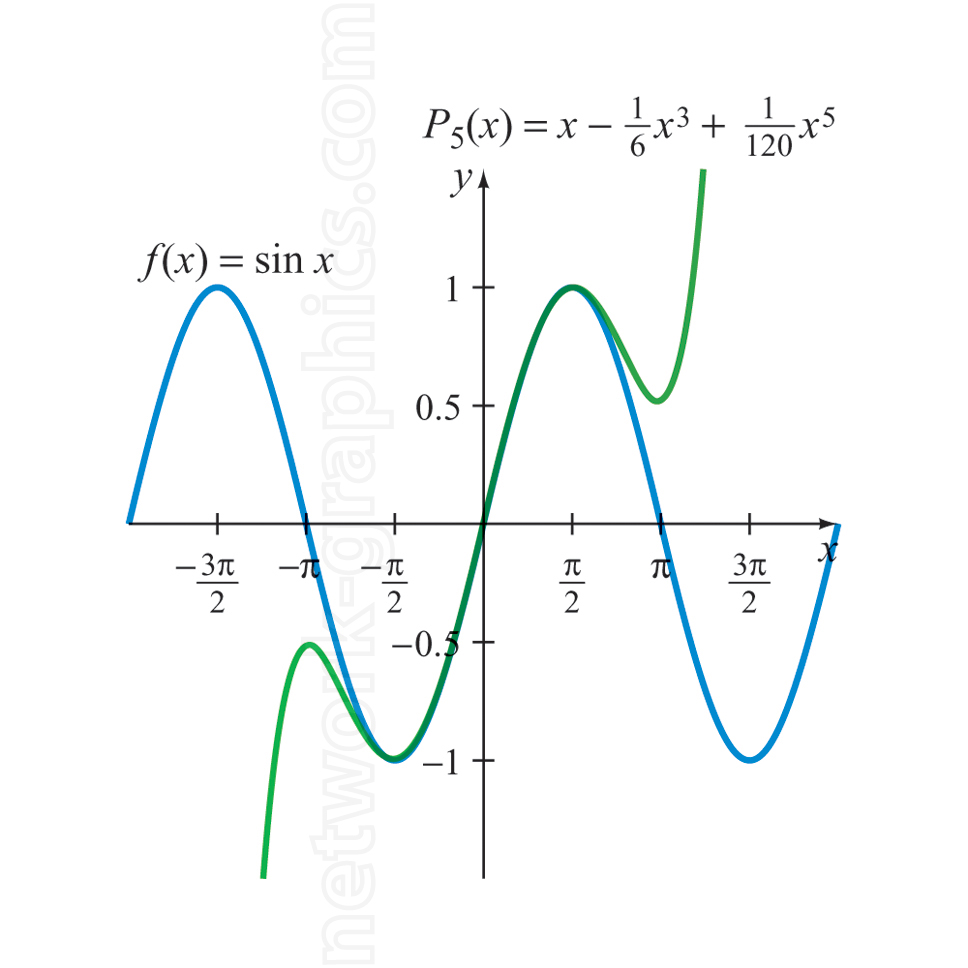
Fitting curves to sin(x).

This image illustrates the process of approximating the trigonometric function f(x) = sin(x) with a fifth-degree Taylor polynomial. Two curves are plotted over the same interval to visually compare the behavior of the original sine function and the approximating the sine function around the origin but diverges at larger values of x.
This illustration is useful for calculus textbooks, numerical analysis courses, and physics applications involving small-angle approximations.
We can provide sample images or create custom illustrations tailored to your projects. If you are looking for an illustration of this type, or from another subject area, you can contact us to discuss your needs.
Network Graphics / Division of Abramson & Wickham Graphics Inc.
All rights reserved.

