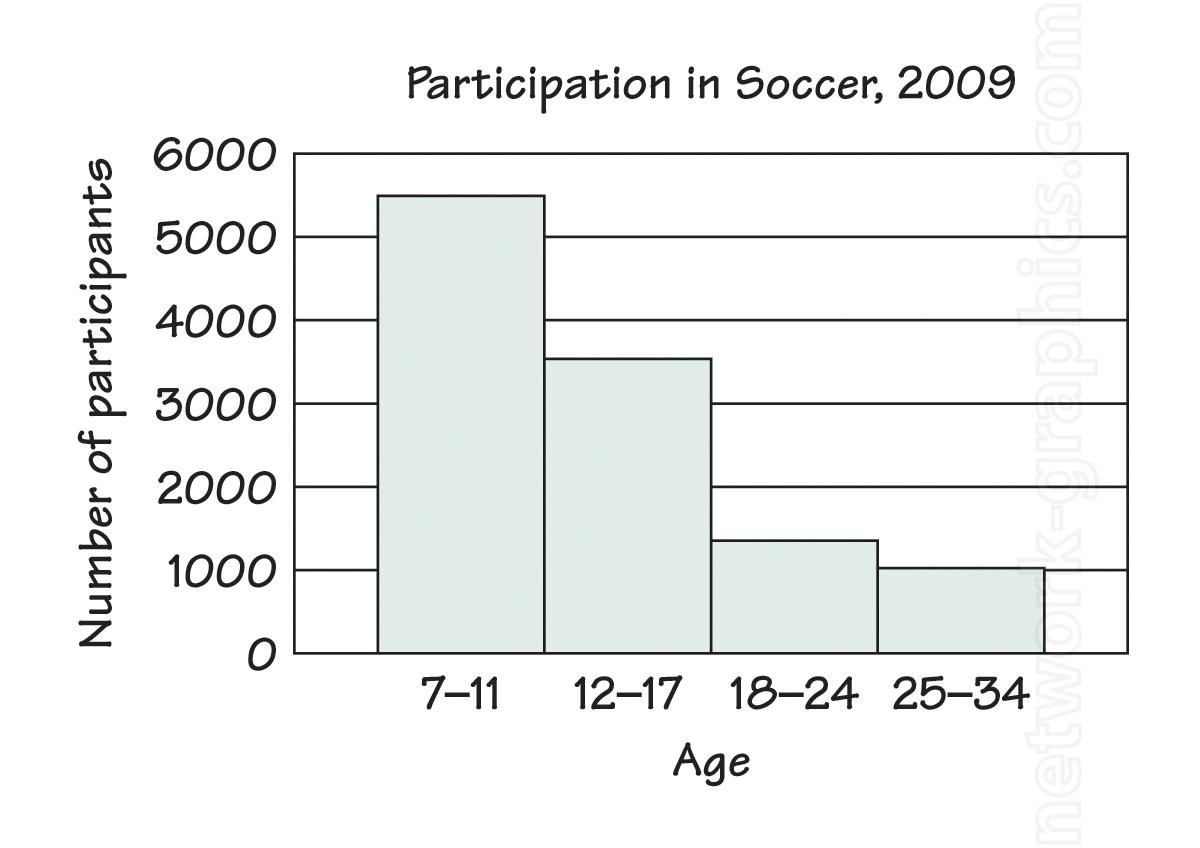
Soccer Participation by Age Group in 2009 Bar Graph

This bar graph, ideal for middle school math and physical education textbooks, illustrates soccer participation in 2009 across different age groups. The visual representation helps students analyze and interpret real-world data trends, fostering a deeper understanding of graphical data interpretation and the relationship between age and sports involvement.
We can provide sample images or create custom illustrations tailored to your projects. If you are looking for an illustration of this type, or from another subject area, you can contact us to discuss your needs.
Network Graphics / Division of Abramson & Wickham Graphics Inc.
All rights reserved.

