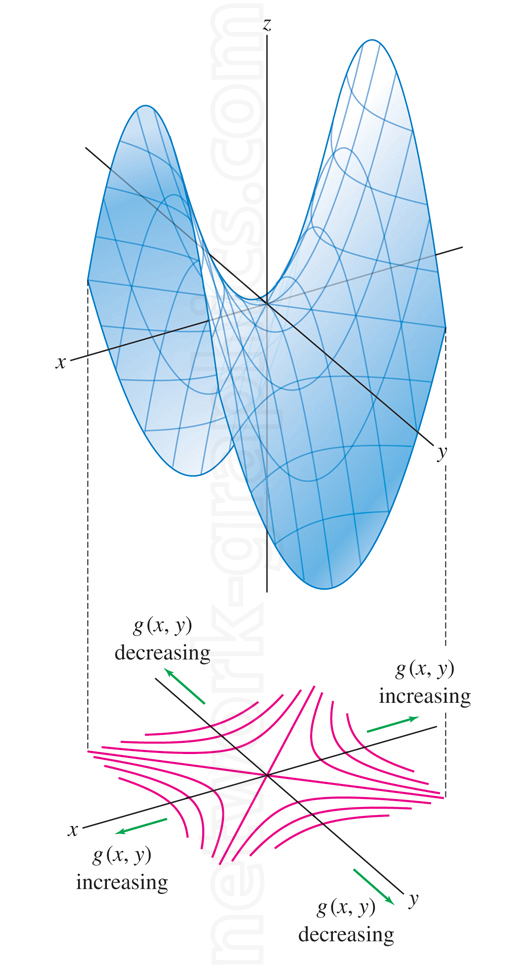
Surface contour curves of a saddle surface.

This illustration presents the saddle surface in three dimensions, accompanied by its contour plot in the xy-plane. The saddle surface exhibits regions of increasing and decreasing behavior, forming a critical point where it curves upward along one axis and downward along another. The surface plot shows the saddle’s hyperbolic shape, while the contour plot below indicates how the values of the function g(x, y) change, highlighting increasing and decreasing gradients along distinct directions.
This diagram is ideal for multivariable calculus and differential geometry textbooks, illustrating key concepts such as saddle points, critical points, contour plots, and partial derivatives.
We can provide sample images or create custom illustrations tailored to your projects. If you are looking for an illustration of this type, or from another subject area, you can contact us to discuss your needs.
Network Graphics / Division of Abramson & Wickham Graphics Inc.
All rights reserved.

