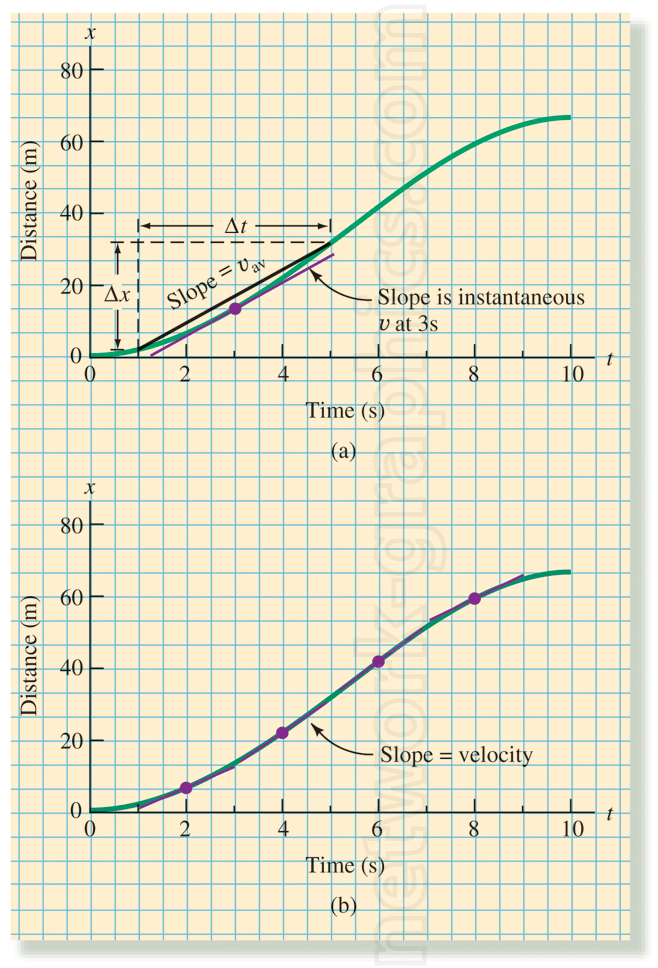
Understanding Slope and Velocity on Distance-Time Graphs.

This illustration explains the concepts of average velocity and instantaneous velocity using distance-time graphs, highlighting how the slope of the curve represents velocity at different time intervals. Ideal for physics textbooks discussing motion analysis, kinematics, and calculus-based approaches to velocity.
We can provide sample images or create custom illustrations tailored to your projects. If you are looking for an illustration of this type, or from another subject area, you can contact us to discuss your needs.
Network Graphics / Division of Abramson & Wickham Graphics Inc.
All rights reserved.

