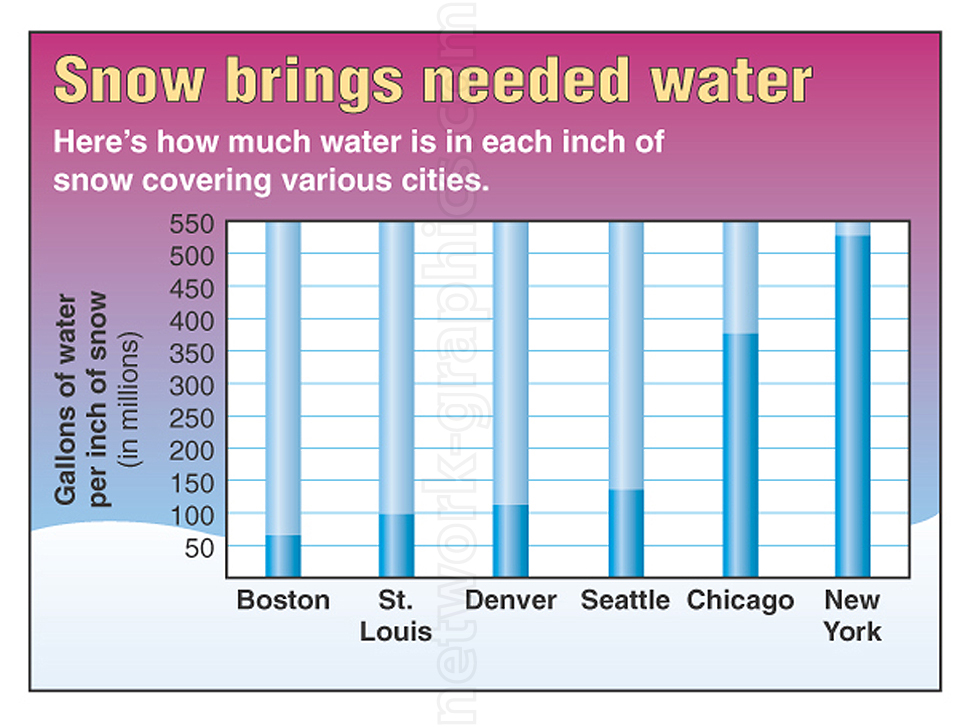
Water Content from Snowfall in Various U.S. Cities Bar Graph

This bar graph, suitable for elementary to high school science textbooks, demonstrates the water yield from one inch of snow in different U.S. cities. It’s a helpful visual aid for understanding the relationship between snowfall and water volume, supporting lessons on weather, precipitation, and water conservation.
We can provide sample images or create custom illustrations tailored to your projects. If you are looking for an illustration of this type, or from another subject area, you can contact us to discuss your needs.
Network Graphics / Division of Abramson & Wickham Graphics Inc.
All rights reserved.

